When testing laptops, we use a suite of benchmarks to show how well the device handles different workloads and tasks. These benchmarks are made to limit the buyer’s remorse, showing potential customers what they’re paying for.
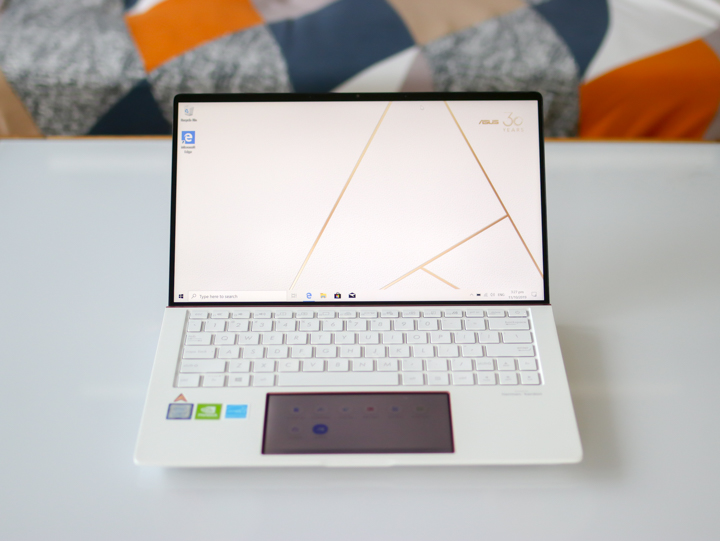
Checking out the benchmark figures are especially important for laptops because even though their specs appear similar, there are a lot of other factors that affect their performance. Cooling capabilities differ, thermal limitations set by manufacturers differ, and other unlisted specs (such as RAM speeds) can cause variations in performance. That being said, what are these benchmarks, and how do you interpret these figures? That’s what we’ll be discussing today.

There are two types of benchmarks: real-world benchmarks and synthetic benchmarks. Real-world benchmarks are easier to understand since the device is running the specific app or game that you’d use daily. Gaming benchmarks typically show the average fps and 1% low, or the lowest 1% fps during testing. Other real-world benchmarks include rendering tests using video editing software such as Adobe Premiere Pro to show how quickly the laptop can export videos.

While seeing how well the laptop performs in all applications is the best way to decide whether or not it’s worth the money, testing for every single application would take way too long to complete. To remedy this, reviewers take advantage of synthetic benchmarks. These benchmarks are created to mimic how real-world programs will run in the system and show an absolute score so that they are comparable with other systems. Typically, synthetic benchmarks are made in a way that limits bottlenecks. If you’re testing how well the CPU performs, your GPU will not affect the result. Likewise, if you’re testing for storage speeds, your CPU will not skew the results. To give you a better understanding, we’ll be listing down the synthetic benchmarks we use and discuss the results.
Table of Contents
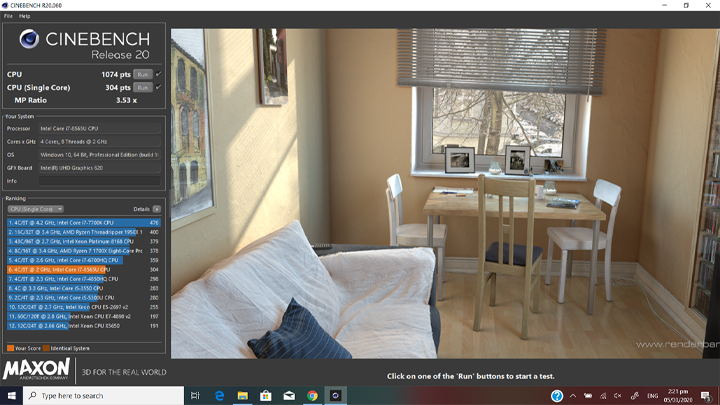
Starting with one of the most popular CPU benchmarks, Cinebench is used to see how well the CPU can render a scene using Cinema 4D’s 3D engine. Users can test using all available CPU cores and a single core to show how well the system performs overall and how well an individual core performs.
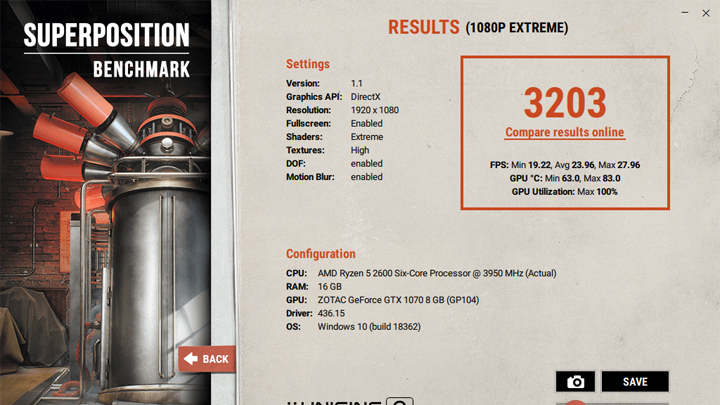
Unigine is a benchmark suite that tests a laptop’s graphical performance and cooling system. The latest version, SuperPosition, uses the UNIGINE 2 Engine and renders 17 scenes using either the DirectX or OpenGL API. When comparing scores, make sure that the settings are identical to one another so you can make an apple to apple comparison. That being said, we always set our reviews to the extreme preset, using the system’s default resolution.
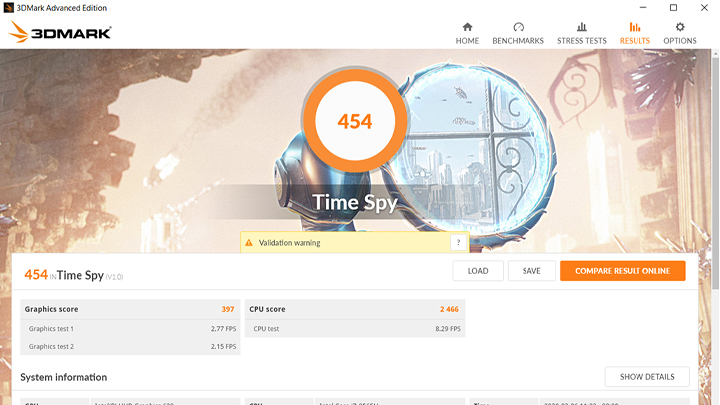
3DMark is the gaming benchmark suite of UL, which includes Fire Strike and Time Spy. These benchmarks attempt to mimic how games will run by rendering a scene using the DirectX11 or DirectX12 API. Unlike the first two benchmarks that tax a specific component, 3D Mark tests the system as a whole. At the end of each test, 3D Mark displays an overall score, followed by a breakdown on the CPU (or the Physics score when using Fire Strike) and the Graphics score.
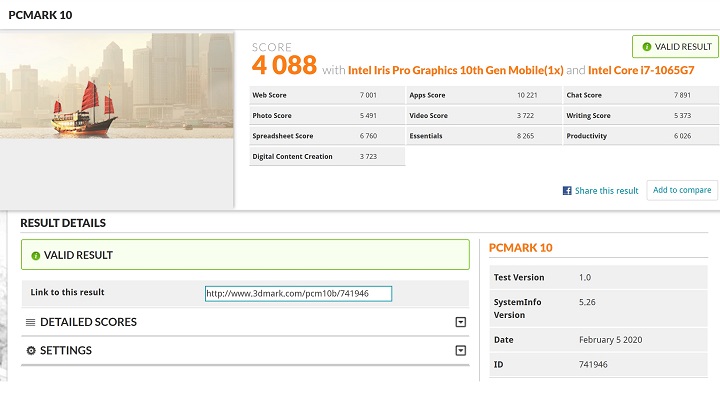
Also developed by UL, PCMark 10 tests the system on real-world applications and activities. These include browsing the internet, video chatting, writing, using spreadsheets, as well as photo and video editing. This test is typically used for ultrabooks and laptops with no integrated graphics, as gaming is not the primary concern.
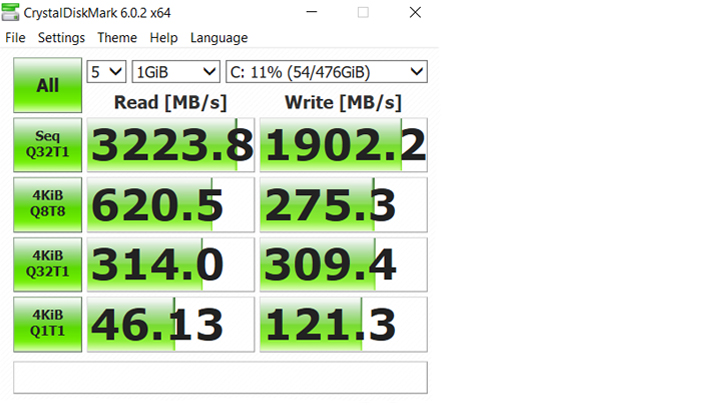
One component often overlooked is storage. The faster your storage is, the quicker you’re able to boot into windows and open apps, which make the system snappier overall. To test for the theoretical speed of the drives, we use Crystal Disk Mark. At the end of the test, it shows you the read and write speeds of Seq Q32T1 (Sequential data using Queue Depth 32, 1 Thread), 4KiB Q8T8 (Random data 4KB using Queue Depth 8 and 8 Threads), 4KiB Q32T1 (Random data 4KB using Queue Depth 32 and 1 Thread), and lastly 4KiB Q1T1 (Random data 4GB using Queue Depth 1 and 1 Thread). In simpler terms:
While the Sequential speeds may appear amazing for most SSDs, the most important figure on Crystal Disk Mark’s results are the 4KiB Q1T1, as this represents almost all real-world scenarios. Opening files, accessing folders, launching applications all use a Queue Depth of 1 and only 1 Thread.

Lastly, we test laptops’ thermal cooling capabilities by running them through a stress test that maxes out the CPU. By running stress tests, we’re able to find out what the thermal limitation the manufacturer has put in place, and the highest frequency the processor can run when put to its limit. The higher the maintained speed of the processor, the better the cooling solution is. For this, we typically use Aida64, running it for at least 15 minutes and noting the recorded current and average speed of the processor.
While you could make a theoretical model that showcases how well a system will perform in real-world applications using synthetic benchmarks, there would be way too many variables to consider. Instead, use them as a guide when comparing two different laptops to see which will offer you more performance for the money. That being said, there are several other factors that come into play when deciding which machine to get. Safety features, portability, color-accurate displays, keyboard & trackpad performance are all valid points to consider. Be sure to read the full review to see how well all these factors add up to help you make the best decision possible.

YugaTech.com is the largest and longest-running technology site in the Philippines. Originally established in October 2002, the site was transformed into a full-fledged technology platform in 2005.
How to transfer, withdraw money from PayPal to GCash
Prices of Starlink satellite in the Philippines
Install Google GBox to Huawei smartphones
Pag-IBIG MP2 online application
How to check PhilHealth contributions online
How to find your SIM card serial number
Globe, PLDT, Converge, Sky: Unli fiber internet plans compared
10 biggest games in the Google Play Store
LTO periodic medical exam for 10-year licenses
Netflix codes to unlock hidden TV shows, movies
Apple, Asus, Cherry Mobile, Huawei, LG, Nokia, Oppo, Samsung, Sony, Vivo, Xiaomi, Lenovo, Infinix Mobile, Pocophone, Honor, iPhone, OnePlus, Tecno, Realme, HTC, Gionee, Kata, IQ00, Redmi, Razer, CloudFone, Motorola, Panasonic, TCL, Wiko
Best Android smartphones between PHP 20,000 - 25,000
Smartphones under PHP 10,000 in the Philippines
Smartphones under PHP 12K Philippines
Best smartphones for kids under PHP 7,000
Smartphones under PHP 15,000 in the Philippines
Best Android smartphones between PHP 15,000 - 20,000
Smartphones under PHP 20,000 in the Philippines
Most affordable 5G phones in the Philippines under PHP 20K
5G smartphones in the Philippines under PHP 16K
Smartphone pricelist Philippines 2024
Smartphone pricelist Philippines 2023
Smartphone pricelist Philippines 2022
Smartphone pricelist Philippines 2021
Smartphone pricelist Philippines 2020